1
Introduction
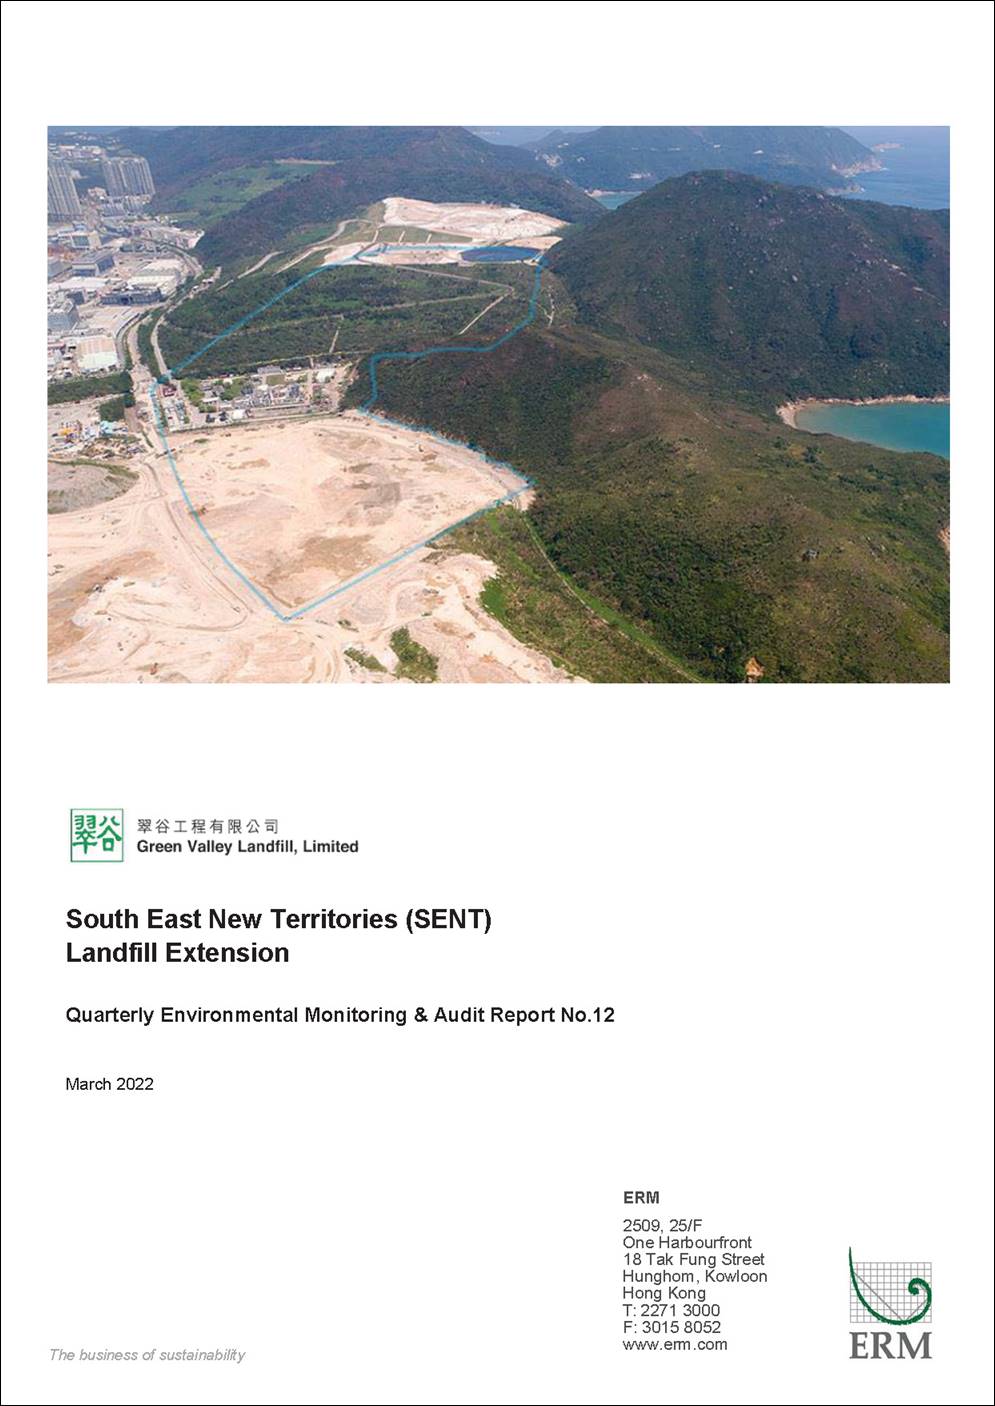
The SENT Landfill Extension (SENTX) forms
an integral part in the Strategic Plan in maintaining the continuity of
landfill capacity in the Hong Kong for the cost-effective and environmentally
satisfactory disposal of waste. The
Environmental Impact Assessment (EIA) Report and the associated Environmental
Monitoring and Audit (EM&A) Manual for the construction, operation,
restoration and aftercare of the SENTX (hereafter referred to as “the Project”)
have been approved under the Environmental Impact Assessment Ordinance
(EIAO) in May 2008 (Register No.: AEIAR-117/2008)
(hereafter referred to as the approved EIA Report) and an
Environmental Permit (EP-308/2008) (EP) was granted by the Director of
Environmental Protection (DEP) on 5 August 2008.
Since
then, applications for Variation of an Environmental Permit (No. VEP-531/2017)
were submitted to EPD and the Variation of Environmental Permits (EP-308/2008/A
and EP-308/2008/B) were granted on 6 January 2012 and 20 January 2017,
respectively, as the Hong Kong SAR Government has decided to reduce the scale
of the design scheme of SENTX assessed in the approved EIA Report and SENTX
will only receive construction waste. In May 2018, a Further Environmental
Permit (FEP) (FEP-01/308/2008/B) was granted to the SENTX’s contractor, Green
Valley Landfill, Limited (GVL).
ERM-Hong Kong, Limited (ERM) and Meinhardt
Infrastructure and Environment Limited (Meinhardt) are commissioned to
undertake the roles of Environmental Team (ET) and the Independent
Environmental Checker (IEC), respectively, to undertake the EM&A activities
for the Project in accordance with the requirements specified in the EP,
updated EM&A Manual (), approved EIA
Report ()
taking account of the latest design and other relevant statutory requirements.
The SENTX is a piggyback landfill, occupying the southern
part of the existing SENT Landfill (including its infrastructure area) and 13
ha of Tseung Kwan O (TKO) Area 137. A layout plan of the SENTX is shown in Figure
1.1. Under the latest design, the SENTX has a net void capacity of
about 6.5 Mm3 and provides an additional lifespan of about 6 years,
commencing operation upon exhaustion of the SENT Landfill. The SENTX will
receive construction waste only.
The key implementation milestones of the Project are indicatively summarised in Table 1.1.
The construction works and operation of the Project commenced on 2 January 2019
and 21 November 2021, respectively.
Table 1.1 Estimated Key Dates of Implementation
Programme
|
Key
Stage of the Project
|
Indicative
Date
|
|
Start
construction
|
2
January 2019
|
|
Commissioning
of new infrastructure facilities
|
2020
|
|
Demolition
of existing infrastructure facilities
|
2021
|
|
Start
waste intake at SENTX
|
21
November 2021
|
|
Estimated
exhaustion date of SENTX
|
2027
|
|
End
of aftercare for SENTX
|
2057
|
The major construction works of the SENTX includes:
·
Site
formation at the TKO Area 137 and the existing infrastructure area at SENT
Landfill;
·
Construction
of surface and groundwater drainage systems;
·
Construction
of the leachate containment and collection systems;
·
Construction
of new leachate and landfill gas treatment facilities, site offices,
maintenance yards at the new infrastructure area;
·
Construction
of new pipelines to transfer the leachate and landfill gas collected from the
existing SENT Landfill to the treatment facilities at the new infrastructure
area;
·
Construction
of the site access and new waste reception facilities; and
·
Demolition
of the facilities at the existing SENT Landfill infrastructure area.
This
is the Quarterly EM&A Report for the Project which summarises the key
findings of the EM&A programme during the reporting period from 1 October to
31 December 2021 for the construction and operation works.
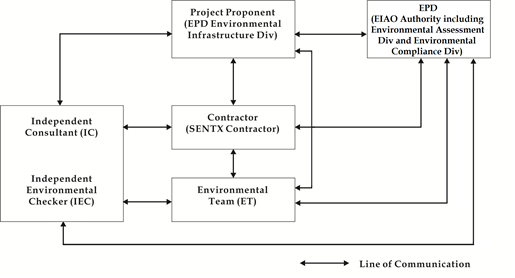
The
organisation structure of the Project is presented in Figure
1.2.
Figure 1.2 Organisation Chart
Contact
details of the key personnel are summarized in Table 1.2 below.
Table 1.2 Contact Information of Key
Personnel
|
Party
|
Position
|
Name
|
Telephone
|
|
Contractor
(Green
Valley Landfill Limited)
|
Project
Manager
|
Gary
Barnicott
|
2706
8827
|
|
|
|
|
|
Environmental
Team (ET) (ERM-Hong Kong, Limited)
|
ET
Leader
|
Frank
Wan
|
2271
3152
|
|
Independent Environmental Checker (IEC)
(Meinhardt Infrastructure and Environment Limited)
|
IEC
|
W.K. Chiu
|
2858 0738
|
The
programme of the construction is shown in Annex A. As informed by the Contractor, the major
works carried out in this reporting period include:
October
2021
·
Follow up on civil
provision work detects at Landfill Gas (LFG) Plant, Leachate Treatment Plant
(LTP) and infrastructure area;
·
Construction of
screeding at LTP;
·
Permanent equipment
installation for sump houses 1, 2 and 3;
·
Construction
of mechanically stabilised earth (MSE) wall and Cell 4X formation;
·
Maintenance
and improvement of temporary surface water drainage; and
·
Underground
utilities and pipes installation at waste reception area.
November
2021
·
Follow up on civil
provision work detects at LFG Plant, LTP, infrastructure area and waste
reception area;
·
Construction of
screeding at LTP;
·
Permanent equipment
installation for sump houses 1, 2 and 3;
·
Maintenance
and improvement of temporary surface water drainage;
·
Demolition
of SENT infrastructure buildings; and
·
Liner works at Cell
4X.
December
2021
·
Follow up on civil
provision work defects at LFG Plant, LTP, infrastructure area and waste
reception area;
·
Construction of
MSE wall;
·
Site
formation for Cell 4X;
·
Liner works at Cell
4X; and
·
Maintenance
and improvement of temporary surface water drainage.
The
implementation schedule of the mitigation measures recommended in the Updated EM&A
Manual is presented in Annex B.
The
status for all environmental aspects are presented in Table 1.3. The
EM&A requirements remained unchanged during the reporting period.
Table 1.3 Summary of Status for the
Environmental Aspects under the Updated EM&A Manual
|
Parameters
|
Status
|
|
Air
Quality
|
|
Baseline
Monitoring
|
The
results of baseline air quality monitoring were reported in Baseline
Monitoring Report and Pre-operation Baseline Monitoring Report and submitted
to EPD under EP Condition 3.3
|
|
Impact
Monitoring
|
On-going
|
|
Noise
|
|
Baseline
Monitoring
|
The
results of baseline noise monitoring were reported in Baseline Monitoring
Report and submitted to EPD under EP Condition 3.3
|
|
Impact
Monitoring
|
On-going
|
|
Water
Quality
|
|
Baseline
Monitoring
|
The
results of baseline surface water quality monitoring were reported in
Baseline Monitoring Report and Pre-operation Baseline Monitoring Report and
submitted to EPD under EP Condition 3.3
|
|
Impact
Monitoring
|
On-going
|
|
Landfill
Gas
|
|
Impact
Monitoring
|
On-going
|
|
Waste
Management
|
|
Waste
Monitoring
|
On-going
|
|
Landscape
and Visual
|
|
Baseline
Monitoring
|
The
results of baseline landscape and visual monitoring were reported in Baseline
Monitoring Report and submitted to EPD under EP Condition 3.3
|
|
Construction
Phase Audit
|
On-going
|
|
Site
Environmental Audit
|
|
Regular
Site Inspection
|
On-going
|
|
Complaint
Hotline and Email Channel
|
On-going
|
|
Environmental
Log Book
|
On-going
|
Taking
into account the construction/operation works, impact monitoring of air
quality, noise, water quality, landfill gas and waste management were carried
out in the reporting period. The impact monitoring schedule of air quality, noise,
water quality and landfill gas monitoring are provided in Annex C.
The
EM&A programme also involved environmental site inspections and related
auditing conducted by the ET for checking the implementation of the required
environmental mitigation measures recommended in the approved EIA Report and
relevant EP submissions. To promote the environmental awareness and enhance
the environmental performance of the contractors, environmental trainings and
regular environmental management meetings were conducted during the reporting
period, which are summarised as below:
Ÿ
Three
environmental management meetings were held with the Contractor, ER, ET, IEC
and EPD on 21 October, 26 November and 16 December 2021; and
Ÿ
Environmental
toolbox trainings on the following topics were provided by the Contractor to
the workers:
Ÿ
Cut
Down Construction Dust on
6 October 2021;
Ÿ
Waste
Water Management on
20 October 2021;
Ÿ
Trip
Ticket System on
10 November 2021;
Ÿ
Illegal
Dumping on
23 November 2021;
Ÿ
Noise
Control Ordinance on
8 December 2021; and
Ÿ
Air
Pollution Control (NRMM) Regulation on 22 December 2021 .
The
status of
statutory environmental compliance with the EP conditions under the EIAO,
submission status under the EP and implementation status of the recommended mitigation
measures are presented in Table
1.4.
Table 1.4 Status of Submissions required
under the EP and Implementation Status of the recommended Mitigation Measures
|
EP Condition
|
Submission /
Implementation Status
|
Status
|
|
2.3
|
Management Organisation of
Main Construction Companies
|
Submitted and accepted by
EPD.
|
|
2.4
|
Setting up of Community
Liaison Group
|
Community Liaison Group
was set up.
|
|
2.5
|
Submission of Detailed
Landfill Gas Hazard Assessment Report
|
Submitted, and accepted by
EPD on 10 January 2019.
|
|
2.6
|
Submission of Restoration
and Ecological Enhancement Plan
|
Submitted to EPD on 28
June 2019.
|
|
2.7
|
Setting up of Trial
Nursery
|
Trial Nursery works was
commenced on 28 August 2019.
|
|
2.8
|
Advance Screen Planting
|
Advance Screen Planting
works were completed on 28 June 2019.
|
|
2.9
|
Provision of Multi-layer
Composite Liner System
|
Under implementation.
|
The
environmental licenses and permits (including EP, Water Pollution Control
Ordinance (WPCO) discharge license, registration as a chemical waste
producer, and construction noise permit) that are valid in the reporting period
are presented in Table 1.5. No non-compliance with environmental
statutory requirements was identified.
Table 1.5 Status of Statutory
Environmental Requirements
|
Description
|
Ref No.
|
Status
|
|
Environmental
Permit
|
EP-308/2008
|
Granted on 5
August 2008
|
|
Variation of
Environmental Permit
|
EP-308/2008/A
|
Granted on 6
January 2012
|
|
EP-308/2008/B
|
Granted on 20
January 2017
|
|
Further
Environmental Permit
|
FEP-01/308/2008/B
|
Granted on 16
May 2018
|
|
Water Discharge
License under WPCO (Permit Holder: Chun Wo)
|
Licence No.:
WT00033525-2019
|
Validity from
27 March 2019 to 31 March 2024
|
|
Water Discharge
License under WPCO (Permit Holder: GVL)
|
Licence No.:
WT00036269-2020
|
Validity from
21 June 2020 to 30 June 2022
|
|
Billing Account
for Disposal of Construction Waste
|
Chit Account
Number: 5001692
|
Approved on 28
December 2005
|
|
Registration as
a Chemical Waste Producer (Permit Holder: Chun Wo)
|
5213-839-C3507-10
|
Issued on 23
August 2018
|
|
Registration as
a Chemical Waste Producer (Permit Holder: REC)
|
5518-839-R2289-06
|
Issued on 24
October 2019
|
|
Construction
Noise Permit (Permit Holder: GVL)
|
GW-RE0990-21
|
Validity from 6
October 2021 to 5 April 2022
|
|
Construction
Noise Permit (Permit Holder: Chun Wo)
|
GW-RE0564-21
|
Validity from 7
June 2021 to 6 December 2021
|
|
Construction
Noise Permit (Permit Holder: Paul Y.)
|
GW-RE1138-21
|
Validity from
16 November 2021 to 15 February 2022
|
2
EM&A Results
The
EM&A programme for the Project required environmental monitoring for air
quality, noise, water quality and landfill gas as well as environmental site
inspections for air quality, noise, water quality, landfill gas, waste
management, and landscape and visual impacts. The EM&A requirements and
related findings for each component are summarised in the following sections.
2.1.1
Dust Monitoring
Monitoring Requirements and Equipment
According to the updated EM&A Manual of the
Project, impact air quality monitoring (dust, in term of Total Suspended
Particulates (TSP)) was
carried out at the two designated monitoring locations (i.e. DM1 and DM2) and four designated locations along the site
boundary (i.e. AM1, AM2, AM3 and AM4) during the construction and
operation/restoration phase, respectively, at a 6-day interval. During the
construction phase, as there are two existing TSP monitoring stations (i.e.
TKO-A1 and TKO-A2a) currently operating by the Civil Engineering and
Development Department (CEDD) to monitor the 24-hour TSP levels at the proposed
dust monitoring stations for the SENTX, it is considered that the CEDD
monitoring data can represent the dust condition of the SENTX during the
construction phase.
The Action and Limit Levels of the air quality
monitoring is provided in Table 2.1 below.
Table 2.1 Action and Limit Levels for 24-hour
TSP
|
Monitoring Station
|
Action Level
|
Limit Level
|
|
Construction
Phase:
|
|
|
|
DM-1
– Site Egress
of TKO Area 137 Fill Bank
|
204
µg m-³
|
260
µg m-³
|
|
DM-2A
–Combined
Reception and Exit Office (CREO) of TKO Area 137 Fill Bank
|
193
µg m-³
|
260
µg m-³
|
|
Operation/
Restoration Phase:
|
|
|
|
AM1
- SENTX Site Boundary (North)
|
260
µg m-³
|
260
µg m-³
|
|
AM2
- SENTX Site Boundary (West, near DP3)
|
|
AM3
- SENTX Site Boundary (West, near RC15)
|
|
AM4
- SENTX Site Boundary (West, near EPD building)
|
High volume air samplers (HVSs) in compliance with the
specifications listed under Section 3.2.2 of the updated EM&A Manual were
used to measure 24-hour TSP levels at the CEDD dust monitoring stations. The
HVSs were calibrated upon installation and thereafter at bi-monthly intervals
to check the validity and accuracy of the results.
The equipment used in the impact air quality monitoring
programme and
monitoring locations are summarised in Table 2.2 and illustrated in Figure 2.1 respectively.
Table 2.2 Dust Monitoring Details
|
Monitoring Station
|
Location
|
Parameter
|
Frequency and Duration
|
Monitoring Dates
|
Equipment
|
|
Construction Phase
|
|
DM1
|
Site Egress of TKO Area
137 Fill Bank
|
24-hour TSP
|
Once every 6 days
|
3, 11, 15, 21, 27 October
2021
2, 8, 14, 20 November 2021
|
HVS Greasby 105 (S/N: 9795
(ET/EA/003/18))
|
|
DM2
|
Combined Reception and Exit
Office (CREO) of TKO Area 137 Fill Bank
|
HVS
Andersen G1051 (S/N: 1176 (ET/EA/003/05))
|
|
Operation/
Restoration Phase
|
|
AM1
|
SENTX Site Boundary (North)
|
24-hour TSP
|
Once
every 6 days
|
25
November 2021
1,
7, 13, 19, 25, 31 December 2021
|
Tisch TE-5170 (S/N: 1190)
|
|
AM2
|
SENTX Site Boundary (West, near DP3)
|
Tisch TE-5170 (S/N: 1047)
|
|
AM3
|
SENTX Site Boundary (West,
near RC15)
|
Tisch TE-5170 (S/N: 1258)
|
|
AM4
|
SENTX Site Boundary (West,
near EPD building)
|
Tisch TE-5170 (S/N: 1101)
|
Monitoring Schedule for the Reporting Period
The
schedule for air quality monitoring during the reporting period is provided in Annex C.
Results and Observations
The
24-hour TSP monitoring results are summarised in Table 2.3. The detailed
monitoring results and the graphical presentation of the 24-hour TSP monitoring
results at each monitoring location are provided in Annex D1.
Table 2.3 Summary of 24-hour TSP
Monitoring Results in the Reporting Period
|
Month
|
Monitoring Station
|
24-hr TSP
Concentration (µg m-3)
|
Action Level (µg/m3)
|
Limit Level (µg/m3)
|
|
Average
|
Range
|
|
Construction Phase
|
|
October 2021
|
DM-1
|
98
|
92 – 112
|
204
|
260
|
|
DM-2
|
92
|
86 - 104
|
193
|
260
|
|
November 2021
|
DM-1
|
101
|
94 - 109
|
204
|
260
|
|
DM-2
|
91
|
86 - 197
|
193
|
260
|
|
Operation/ Restoration
Phase
|
|
November 2021
|
AM1
|
100
|
-
|
260
|
260
|
|
AM2
|
154
|
-
|
260
|
260
|
|
AM3
|
158
|
-
|
260
|
260
|
|
AM4
|
235
|
-
|
260
|
260
|
|
December 2021
|
AM1
|
112
|
57 – 173
|
260
|
260
|
|
AM2
|
129
|
100 - 156
|
260
|
260
|
|
AM3
|
182
|
128 - 258
|
260
|
260
|
|
AM4
|
168
|
102 - 282
|
260
|
260
|
The
major dust sources in the reporting period included fugitive dust emission from
exposed area in SENTX, as well as nearby operations of the SENT landfill and
the TKO Area 137 Fill Bank.
Action
and Limit Levels exceedance was recorded for TSP monitoring in the reporting
period and actions in accordance with the Event and Action Plan presented in Annex D2 were undertaken.
Investigation of the Action and Limit Levels exceedance was conducted and the
investigation report is presented in Annex D6.
Based on the investigation conducted for the monitoring
event with potential Action and Limit Levels exceedance with the Contractor and
the IEC, the TSP exceedance at AM4 on 13 December 2021 was considered non
Project-related. The Contractor was reminded to implement all
relevant mitigation measures for the construction and operation works and
maintain good site practice. The ET will keep track on the monitoring
data and ensure Contractor’s compliance of the environmental requirements.
Meteorological Data
Meteorological
data obtained from the SENTX on-site meteorological monitoring station was used
for the dust monitoring and is shown in Annex D3. It is considered that meteorological data
obtained at the on-site meteorological monitoring station is representative of
the Project area and could be used for the construction/operation phase dust
monitoring programme for the Project.
2.1.2
Odour
Monitoring
Monitoring
Requirements
According to the updated EM&A Manual of the
Project, odour patrol was
carried out along
the site boundary during the operation/ restoration phase. During the first month
of operation, daily odour patrol (3 times per day) was conducted jointly by the
ET and the IEC. The odour intensity detected was based on that determined by
the IEC. In addition, an independent party (ALS Technichem (HK) Pty Ltd.) was
appointed to undertake odour patrol together with the ET and IEC three times
per week. During these patrols, the odour intensity detected was based on that
determined by the independent third party.
The Action and Limit Levels for odour patrol is
provided in Table 2.4 below.
Table 2.4 Action and Limit
Levels for Odour Patrol
|
Parameter
|
Action Level
|
Limit Level
|
|
Perceived odour intensity and odour complaints
|
·
Odour intensity ≥ Class 2 recorded; or
·
One documented complaint received
|
·
Odour intensity ≥ Class 3 recorded on 2
consecutive patrol (a) (b)
|
|
Notes:
(a) i.e.
either Class 3-strong or Class 4-extreme odour intensity.
(b) The
exceedances of the odour intensity do not need to be recorded at the same
location.
|
Odour patrol was conducted by trained personnel
/ competent persons with a specific sensitivity to a reference odour (i.e. on
reference materials n-butanol with the concentration of 50ppm in nitrogen
(v/v)) in
compliance with Section 3.7.2 of the updated EM&A Manual patrolling and sniffing
along the SENTX Site boundary to detect any odour.
The odour monitoring programme and patrol route are
summarised in Table 2.5 and illustrated in Figure 2.2 respectively.
Table 2.5 Odour Monitoring
Details
|
Patrol Locations
|
Parameters
|
Patrol Frequency (a)
|
Monitoring Dates and Time
|
|
Patrol along the SENTX Site Boundary (Checkpoints OP1 –
OP11 (d))
|
Odour Intensity (see Table 2.6)
|
Period
1 - First month of operation
Daily, three times a day in the morning, afternoon and
evening/night (between 18:00 and 22:00 hrs) conducted by the ET and the IEC
Three times per week on different days conducted by an
independent third party together with the ET and IEC (b)
Period
2 - Three months following period 1 (c)
Weekly conducted by the ET and the IEC
Once
every two weeks conducted by an independent third party
together with the ET and IEC (b)
Period
3 - Throughout operation following period 2 (c)
Monthly conducted by the ET and the IEC
Quarterly conducted by an independent third party
together with the ET and IEC (b)
|
Conducted by ET & IEC:
21 – 30 Nov 2021,
1 – 31 Dec 2021
(10:30 – 12:00, 14:30 – 16:00, 18:00 – 19:30)
Conducted by an independent third party, ET
& IEC:
22 Nov 2021 (14:30 – 16:00), 24 Nov 2021 (10:00 – 12:00),
26 Nov 2021 (14:30 – 16:00), 29 Nov 2021 (14:30 – 16:00), 1 Dec 2021 (14:30 –
16:00), 3 Dec 2021 (10:00 – 12:00), 6 Dec 2021 (14:30 – 16:00), 8 Dec 2021
(10:00 – 12:00), 10 Dec 2021 (10:00 – 12:00), 13 Dec 2021 (10:00 – 12:00), 15
Dec 2021 (10:00 – 12:00), 17 Dec 2021 (14:30 – 16:00), 20 Dec 2021 (10:00 –
12:00), 22 Dec 2021 (14:30 – 16:00), 24 Dec 2021 (14:30 – 16:00), 28 Dec 2021
(14:30 – 16:00), 29 Dec 2021 (10:00 – 12:00), 31 Dec 2021 (14:30 – 16:00)
|
|
Notes:
(a) Reduction
of monitoring frequency will be subject to the monitoring results to
demonstrate environmentally acceptable performance.
(b) Patrol
shall be scheduled so that they are carried out together with the patrols to
be carried out jointly by the ET and the IEC.
(c) Commencement
of each period will be justified by the ET Leader and
verified by the IEC and will be subject to agreement with the EPD (EIAO
Authority) and Project Proponent.
(d) The
revised odour patrol route with the addition of checkpoint OP11 was applied
from 10 December 2021.
|
Table 2.6 Odour Intensity
Level
|
Class
|
Odour
Intensity
|
Description
|
|
0
|
Not
Detected
|
No
odour perceived or an odour so weak that it cannot be easily characterised or
described.
|
|
1
|
Slight
|
Identified
odour, slight
|
|
2
|
Moderate
|
Identified
odour, moderate
|
|
3
|
Strong
|
Identified
odour, strong
|
|
4
|
Extreme
|
Severe
odour
|
Monitoring
Schedule for the Reporting Month
The
schedule for odour patrol during the reporting period is provided in Annex C.
Results
and Observations
The
odour monitoring results are summarised and provided in Table 2.7 and Annex D4, respectively.
Table 2.7 Summary of Odour
Monitoring Results in the Reporting Period
|
Odour
Checkpoints
|
Odour
Intensity Class (Range)
|
Action
Level
|
Limit
Level
|
|
OP1
|
0
– 1
|
Odour intensity ≥ Class 2 recorded
|
Odour
intensity ≥ Class 3 recorded on 2 consecutive patrol
|
|
OP2
|
0
– 1
|
|
OP3
|
0
– 1
|
|
OP4
|
0
– 1
|
|
OP5
|
0
– 1
|
|
OP6
|
0
– 1
|
|
OP7
|
0
– 1
|
|
OP8
|
0
– 1
|
|
OP9
|
0
– 1
|
|
OP10
|
0
|
|
OP11
|
0
– 1
|
|
|
The
potential odour sources in the reporting period included the construction
works, operation of leachate treatment plant, generator, slurry truck,
excavator, vehicles and vegetation at SENTX, as well as nearby operations of
the Town Gas Plant.
All
the odour monitoring results were below the Action and Limit Levels in the
reporting period. No action is thus required to be undertaken in accordance
with the Event and Action Plan presented in Annex D2.
2.1.3
Thermal
Oxidiser, Landfill Gas Flare and Landfill Gas Generator Stack Emission
Monitoring
Monitoring
Requirements and Equipment
According to the updated EM&A Manual of the
Project, the
performance of the thermal oxidiser, landfill gas flare and landfill gas
generator was monitored when they are in operation. Gas samples were
collected from the stack of the thermal oxidizer, landfill gas flare and
landfill gas generator
for laboratory analysis for NO2, CO, SO2,
Benzene and Vinyl chloride and in-situ analysis for exhaust gas velocity at monthly interval.
The
operating conditions of the thermal oxidiser, landfill gas flare and landfill gas
generator
were also monitored continuously.
The Limit Levels for stack emission of the
thermal oxidiser, landfill gas flare and landfill gas generator are provided in Tables
2.8 – 2.10 below.
Table 2.8 Limit Levels for
Stack Emission of the Thermal Oxidiser
|
Parameters
|
Limit
Level
|
|
NO2
|
1.58
gs-1
|
|
CO
|
0.53
gs-1
|
|
SO2
|
0.07
gs-1
|
|
Benzene
|
3.01
x 10-2 gs-1
|
|
Vinyl
chloride
|
2.23
x 10-3 gs-1
|
|
Gas
combustion temperature
|
850oC
(minimum)
|
|
Exhaust
gas exit temperature
|
443K
(minimum) (a)
|
|
Exhaust
gas velocity
|
7.5
ms-1 (minimum) (a)
|
|
Note:
(a) Level
under full load condition.
|
|
Table 2.9 Limit Levels for
Stack Emission of the Landfill Gas Flare
|
Parameters
|
Limit
Level
|
|
NO2
|
0.97
gs-1
|
|
CO
|
2.43
gs-1
|
|
SO2
|
0.22
gs-1
|
|
Benzene
|
4.14
x 10-4 gs-1
|
|
Vinyl
Chloride
|
2.60
x 10-4 gs-1
|
|
Gas
combustion temperature
|
815oC
(minimum)
|
|
Exhaust
gas exit temperature
|
923
K (minimum) (a)
|
|
Exhaust
gas velocity
|
9.0
m s-1 (minimum) (a)
|
|
Note:
(a) Level
under full load condition.
|
|
Table 2.10 Limit Levels for
Stack Emission of the Landfill Gas Generator
|
Parameters
|
Limit
Level
|
|
NO2
|
1.91
gs-1
|
|
CO
|
2.48
gs-1
|
|
SO2
|
0.528
gs-1
|
|
Benzene
|
2.47
x 10-4 gs-1
|
|
Vinyl
chloride
|
1.88
x 10-5 gs-1
|
|
Gas
combustion temperature
|
450oC
(minimum)
|
|
Exhaust
gas exit temperature
|
723K
(minimum) (a)
|
|
Exhaust
gas velocity
|
30.0
ms-1 (minimum) (a)
|
|
Note:
(a) Level
under full load condition.
|
|
Gas samples were collected from the centroid of
the stack with stainless steel sampling probe, into inert sample containers
(i.e. Canister and Tedlar Bag) and transferred
to ALS Technichem (HK) Pty Ltd. (HOKLAS Registration No. 066) laboratory within
24 hours of collection for direct
analysis on a gas chromatography within
48 hours after collection. The
flue gas velocity of the gas stream at the exhaust of thermal oxidize was
determined by S-Pitot tube during the emission sampling.
The
stack emission monitoring programme and monitoring locations are summarised in Table
2.11 and illustrated in Figure 2.1, respectively.
Table 2.11 Thermal Oxidiser,
Landfill Gas Flare and Landfill Gas Generator Stack Emission Monitoring Details
|
Monitoring
Location
|
Parameter
|
Frequency
|
Monitoring
Date
|
|
Stack
of Thermal Oxidiser
|
Laboratory
analysis for
· NO2
· CO
· SO2
· Benzene
· Vinyl
chloride
In-situ
analysis for
· Exhaust
gas velocity
|
Monthly
for the first 12 months of operation and thereafter at quarterly intervals
|
20
Dec 2021
|
|
· Gas
combustion temperature
· Exhaust
temperature
· Exhaust
gas velocity (a)
|
Continuously
|
1 –
31 Dec 2021
|
|
Stack
of Landfill Gas Flare
|
Laboratory
analysis for
· NO2
· CO
· SO2
· Benzene
· Vinyl
chloride
In-situ
analysis for
·
Exhaust
gas velocity
|
Monthly
for the first 12 months of operation and thereafter at quarterly intervals
|
17
Dec 2021
|
|
· Gas
combustion temperature
· Exhaust
temperature
· Exhaust
gas velocity (a)
|
Continuously
|
1 –
31 Dec 2021
|
|
Stack
of Landfill Gas Generator
|
Laboratory
analysis for
· NO2
· CO
· SO2
· Benzene
· Vinyl
chloride
In-situ
analysis for
·
Exhaust
gas velocity
|
Monthly
for the first 12 months of operation and thereafter at quarterly intervals
|
17
Dec 2021
|
|
· Exhaust
temperature
· Exhaust
gas velocity (a)
|
Continuously
|
1 –
31 Dec 2021
|
|
Note:
(a) The
exhaust gas velocity will be calculated based on the cross-section area of
the stack and continuous monitored gas flow and combustion temperature data.
|
Monitoring
Schedule for the Reporting Month
The
schedule for thermal oxidizer, landfill gas flare and landfill gas generator
stack emission monitoring during the reporting period is provided in Annex C.
Results
and Observations
The
thermal oxidizer, landfill gas flare and landfill gas generator stack emission
monitoring results and detailed continuous monitoring results are summarised in
Tables 2.12 - 2.14 and provided in Annex D5, respectively.
Table 2.12 Summary of Thermal Oxidiser Stack Emission
Monitoring in
the Reporting Period
|
Parameters
|
Monitoring
Results (Range in Bracket)
|
Limit
Level
|
|
NO2
|
0.38
gs-1
|
1.58
gs-1
|
|
CO
|
<0.02
gs-1
|
0.53
gs-1
|
|
SO2
|
<0.01
gs-1
|
0.07
gs-1
|
|
Benzene
|
<2
x 10-5 gs-1
|
3.01
x 10-2 gs-1
|
|
Vinyl
chloride
|
<2
x 10-5 gs-1
|
2.23
x 10-3 gs-1
|
|
Gas
combustion temperature
|
943oC
(932oC - 984oC)
|
850oC
(minimum)
|
|
Exhaust
gas exit temperature
|
1,237K
(1,219K – 1,316K)
|
443K
(minimum) (a)
|
|
Exhaust
gas velocity
|
15.3
(b)
|
7.5
ms-1 (minimum) (a)
|
|
Note:
(a) Level
under full load condition.
(b) The
exhaust gas velocity was calculated based on the cross-section area of the
stack and the gas flow and combustion temperature data measured during the
stack emission monitoring. The limit level was not applicable as
the stack was not operated under full load condition.
|
Table 2.13 Summary of Landfill Gas Flare Stack Emission
Monitoring in
the Reporting Period
|
Parameters
|
Monitoring
Results (Range in Bracket)
|
Limit
Level
|
|
NO2
|
<0.02
gs-1
|
0.97
gs-1
|
|
CO
|
2.81
gs-1
|
2.43
gs-1
|
|
SO2
|
0.11
gs-1
|
0.22
gs-1
|
|
Benzene
|
9.9
x 10-5 gs-1
|
4.14
x 10-4 gs-1
|
|
Vinyl
chloride
|
<1.4
x 10-5 gs-1
|
2.60
x 10-4 gs-1
|
|
Gas
combustion temperature
|
Flare
1: 864oC (820oC - 935oC)
Flare
2: 853oC (820oC - 894oC)
|
815oC
(minimum)
|
|
Exhaust
gas exit temperature
|
Flare
1: 1,059K (1,025K – 1,115K)
Flare
2: 1,027K (944K – 1,097K)
|
923
K (minimum) (a)
|
|
Exhaust
gas velocity
|
9.1
(b)
|
9.0
m s-1 (minimum) (a)
|
|
Note:
(a) Level
under full load condition.
(b) The
exhaust gas velocity was calculated based on the cross-section area of the
stack and the gas flow and combustion temperature data measured during the
stack emission monitoring. The limit level was not applicable as
the stack was not operated under full load condition.
|
Table 2.14 Summary of Landfill Gas Generator Stack Emission
Monitoring in
the Reporting Period
|
Parameters
|
Monitoring
Results (Range in Bracket)
|
Limit
Level
|
|
NO2
|
0.007
gs-1
|
1.91
gs-1
|
|
CO
|
0.046
gs-1
|
2.48
gs-1
|
|
SO2
|
0.074
gs-1
|
0.528
gs-1
|
|
Benzene
|
4
x 10-6 gs-1
|
2.47
x 10-4 gs-1
|
|
Vinyl
chloride
|
<1.2
x 10-6 gs-1
|
1.88
x 10-5 gs-1
|
|
Exhaust
gas exit temperature
|
838K
(748K – 847K)
|
723K
(minimum) (a)
|
|
Exhaust
gas velocity
|
17.6
(b)
|
30.0
ms-1 (minimum) (a)
|
|
Note:
(a) Level
under full load condition.
(b) The
exhaust gas velocity was calculated based on the cross-section area of the
stack and the gas flow and combustion temperature data measured during the
stack emission monitoring. The limit level was not applicable as
the stack was not operated under full load condition.
|
Limit
Levels exceedance was recorded for landfill gas flare stack emission (CO) in the reporting period and actions in
accordance with the Event and Action Plan presented in Annex D2 were undertaken. Investigation
of the Limit Levels exceedance was conducted and the investigation report is
presented in Annex D6.
Based on the investigation conducted for the monitoring
event with potential Limit Levels exceedance with the Contractor and the IEC,
the landfill gas flare stack emission (CO)
exceedance on 17 December 2021 was found to be Project-related. The Contractor was reminded
to implement all relevant mitigation measures for the construction and
operation works and maintain good site practice. The ET will keep track
on the monitoring data and ensure Contractor’s compliance of the environmental
requirements.
2.2
Noise Monitoring
2.2.1
Monitoring
Requirements and Equipment
According
to the updated
EM&A
Manual of the Project, impact
noise monitoring was conducted weekly at the monitoring location (i.e. NM1) to obtain one set of 30 minutes measurement
between 07:00 and 19:00 hours on normal weekdays.
The
Action and Limit Levels for construction and operational noise of the Project are
provided in Table 2.15 below.
Table 2.15 Action and
Limit Levels for Construction/Operational Noise
|
Time Period
|
Action
Level (a)
|
Limit Level
(b)
|
|
Construction Noise:
|
|
|
|
07:00 – 19:00
hrs on normal weekdays
|
When one
documented complaint is received from any one of the noise sensitive
receivers (NSRs)
or
75 dB(A)
recorded at the monitoring station
|
75 dB(A) at NSRs
|
|
Operational
Noise:
|
|
|
|
07:00 – 19:00
hrs on all days
|
When one
documented complaint is received from any one of the noise sensitive
receivers (NSRs)
or
75 dB(A)
recorded at the monitoring station
|
65 dB(A) at
NSRs (c)
|
|
19:00 – 23:00
hrs on all days
|
65 dB(A) at
NSRs (c)
|
|
23:00 – 07:00
hrs on all days
|
55 dB(A) at
NSRs (c)
|
|
Notes:
(a)
75dB(A) along and at about 100m from the
SENTX site boundary was set as the Action Level.
(b)
Limits specified in the GW-TM and IND-TM for
construction and operational noise, respectively.
(c)
Limit Level only apply to
operational noise without road traffic and construction activities noise.
|
Noise
monitoring was performed by ALS Technichem (HK) Pty Ltd (HOKLAS Registration
No. 066) using a sound level meter placed at the designated monitoring station NM1
(see Figure 2.1) in accordance with the requirements
stipulated in the updated EM&A Manual. Acoustic
calibrator was deployed to check the sound level meter at a known sound
pressure level. Details of the deployed equipment are provided in Table 2.16.
Table 2.16 Noise Monitoring Details
|
Monitoring Station (1)
|
Location
|
Parameter
|
Frequency and Duration
|
Monitoring Dates
|
Equipment
|
|
NM1
|
SENTX
Site Boundary (North)
|
Leq
(30 min) measurement
between 07:00 and 19:00 hours on normal weekdays
(Monday
to Saturday)
|
Once
per week for 30 mins during the construction and operation period
of the Project
|
7,
15, 21, 28 October 2021
4,
11, 18, 25 November 2021
2,
9, 14, 22, 28 December 2021
|
Sound
Level Meter:
B&K
2238 (S/N: 2285721)
Rion
NL-31 (S/N: 00410221)
B&K
2238 (S/N: 2285722)
Rion
NL-52 (S/N: 00921191)
Acoustic
Calibrator:
Rion
NC-73 (S/N: 10655561)
Rion
NC-74 (S/N: 34657230)
Rion
NC-75 (S/N: 34680623)
|
2.2.2
Monitoring Schedule
for the Reporting Period
The
schedule for noise monitoring during the reporting period is provided in Annex C.
2.2.3
Results and
Observations
A
total of 13 impact noise monitoring events were scheduled during the reporting
period. However, noise monitoring on 15 October 2021 was cancelled due to
adverse weather. The noise monitoring results are summarised in Table 2.17
and graphically presented in Annex
E1.
Table 2.17 Summary of Construction/Operation
Noise Monitoring Results in the Reporting Period
|
Month
|
Monitoring Station
|
Measured
Noise Level Leq
(30 min), dB(A)
|
|
Average
|
Range
|
Action
and Limit Level
|
|
October 2021
|
NM1
|
53.5
|
49.7 – 56.4
|
75
|
|
November 2021
|
NM1
|
51.4
|
49.0 – 53.4
|
75
|
|
December 2021
|
NM1
|
49.9
|
47.0 – 51.1
|
75
|
Major
noise sources identified during the noise monitoring included noise from
operations of the existing SENT landfill and the TKO Area 137 Fill Bank,
aircrafts and insects.
No
exceedance of the Action and Limit Levels for construction/operation noise
monitoring was recorded in the reporting period. No further mitigation measure
was required in accordance with the Event and Action Plan presented in Annex E2.
2.3
Water Quality Monitoring
2.3.1
Surface Water
Quality Monitoring
Monitoring Requirements and Equipment
According
to the updated EM&A Manual of the Project, impact surface water quality
monitoring were carried out at the three designated surface water discharge
points (i.e. DP3, DP4 and DP6) at weekly and monthly intervals during
construction phase and operation/ restoration phase, respectively to ensure that
the SENTX will not cause adverse water quality impact. Temporary relocation of
surface water discharge point DP4 to DP4 (Future, temporary) as an interim
arrangement due to site constraints and construction sequence was approved by
EPD on 14 May 2019. Impact surface water quality monitoring was carried out at
DP4 (Future, temporary) (i.e. DP4T) from the monitoring event on 16 May 2019. In addition, suspension of impact
surface water quality monitoring at DP3 was approved under the Baseline
Monitoring Report by EPD on 24 July 2019 until the actual commencement of
construction works affecting DP3 in 2022.
Dissolved
Oxygen (DO) and pH value were measured in situ whereas the level of
suspended solids (SS) were determined by ALS Technichem (HK) Pty Ltd (HOKLAS
Registration No. 066).
The
Action and Limit Levels of the surface water quality impact monitoring are
provided in Table 2.18.
Table 2.18 Action and
Limit Levels for Surface Water Quality
|
Parameters
|
Action Level
|
Limit Level
|
|
|
DP4 & DP6
|
|
Construction Phase:
|
|
|
|
DO
|
< 5.80 mg/L
|
< 5.42 mg/L
|
|
SS
|
> 11.7 mg/L
|
> 12.7 mg/L
|
|
pH
|
> 8.39
|
> 8.40
|
|
Operation/
Restoration Phase:
|
|
Ammoniacal-nitrogen
|
|
> 7.1 mg/L
|
|
COD
|
|
> 30 mg/L
|
|
SS
|
|
> 20 mg/L
|
The locations of the monitoring stations for the Project
are shown in Figure 2.1. All in situ monitoring instruments
were checked, calibrated and certified by a laboratory accredited under HOKLAS
or other international accreditation scheme before use, and subsequently
re-calibrated at 3 monthly intervals throughout all stages of the surface water
quality monitoring programme. Calibration
for a DO meter was carried out before measurement according to the instruction
manual of the equipment model. Details of the equipment used in the impact surface water quality
monitoring works are provided
in Table 2.19.
Table 2.19 Impact Surface Water Quality
Monitoring Details
|
Monitoring Station
|
Location
|
Frequency
|
Monitoring Dates
|
Parameter
|
Equipment
|
|
Construction
Phase:
|
|
DP4 (Future, temporary)
|
Surface water discharge
point DP4
|
Weekly
|
7, 15, 21, 28 October 2021
4, 11, 18 November 2021
|
•pH
•DO
•SS
|
YSI Professional DSS (S/N: 15H103928)
|
|
DP6
|
Surface water discharge
point DP6
|
|
Operation/
Restoration Phase:
|
|
DP4 (Future, temporary)
|
Surface water discharge
point DP4
|
Monthly
|
25
November 2021, 28 December 2021
|
· pH
· Electrical
conductivity (EC)
· DO
· SS
· COD
· BOD5
· TOC
· Ammoniacal–nitrogen
· Nitrate-nitrogen
· Nitrite–nitrogen
· TKN
· TN
· Phosphate
· Sulphate
· Sulphide
· Carbonate
· Oil &
Grease
|
· Bicarbonate
· Chloride
· Sodium
· Potassium
· Calcium
· Magnesium
· Nickel
· Manganese
· Chromium
· Cadmium
· Copper
· Lead
· Iron
· Zinc
· Mercury
· Boron
|
YSI Professional DSS (S/N: 15H103928)
YSI Professional DSS (S/N: 17B102764)
|
|
DP6
|
Surface water discharge
point DP6
|
|
Notes:
(a)
DP4 was temporary
relocated to DP4 (Future, temporary) (i.e. DP4T) as an interim discharge
point from the monitoring event on 16 May 2019.
(b)
Impact surface
water quality monitoring at DP3 was suspended from the monitoring event on 25
July 2019 until the actual commencement of
construction works affecting DP3 in 2021.
|
Monitoring Schedule for the Reporting Period
The
schedule for surface water quality monitoring during the reporting period is
provided in Annex C.
Results and Observations
A
total of 9 monitoring events for impact surface water quality monitoring were scheduled
at all designated monitoring stations during the reporting period. However,
sampling could not be carried out at the monitoring events below due to
insufficient flow:
·
October 2021 at all
monitoring locations;
·
4 November 2021 at
all monitoring locations;
·
18 November 2021 at
all monitoring locations;
·
25 November 2021 at
all monitoring locations; and
·
28 December 2021 at
all monitoring locations.
Impact surface water quality monitoring
results and graphical presentations are provided in Annex
F1.
All
the surface water monitoring results were below the Action and Limit Levels in
the reporting period. No
action is thus required to be undertaken in accordance with the Event and
Action Plan presented in Annex F2.
2.3.2
Leachate Monitoring
Monitoring Requirements and Equipment
According
to the updated EM&A Manual, continuous monitoring of leachate level and
daily monitoring of effluent quality were carried out during the operation/
restoration phase.
Temperature,
pH and volume of the effluent discharged from the leachate treatment plant were
measured in-situ whereas the parameters as listed in Table 2.21 were
determined by ALS Technichem (HK) Pty Ltd. (HOKLAS Registration No. 066).
The
Limit Levels of the leachate monitoring are provided in Table 2.20.
Table 2.20 Limit Levels
for Leachate Levels and Effluent Quality
|
Parameters
|
Limit Level
|
|
Leachate Levels
|
|
|
Leachate levels above
the basal liner
|
1 m above the primary liner of the
leachate containment system
|
|
Effluent Quality
|
|
Temperature
|
> 43 °C
|
|
pH Value
|
6 – 10
|
|
Volume Discharged
|
>1,500 m³
|
|
Suspended Solids (SS)
|
> 800 mg/L
|
|
Ammoniacal-nitrogen
|
> 100 mg/L
|
|
Nitrite-nitrogen
|
> 100 mg/L
|
|
Phosphate
|
> 25 mg/L
|
|
Sulphate
|
> 900 mg/L
|
|
Nitrate-nitrogen
|
> 100 mg/L
|
|
Biochemical Oxygen Demand
(BOD)
|
> 800 mg/L
|
|
Chemical Oxygen Demand
(COD)
|
> 2,000 mg/L
|
|
Oil & Grease
|
> 20 mg/L
|
|
Boron
|
> 7,000 µg/L
|
|
Iron
|
> 7.5 mg/L
|
|
Cadmium
|
> 1 µg/L
|
|
Chromium
|
> 400 µg/L
|
|
Copper
|
> 1,000 µg/L
|
|
Nickel
|
> 800 µg/L
|
|
Zinc
|
> 800 µg/L
|
All in situ monitoring instruments were checked,
calibrated and certified by a laboratory accredited under HOKLAS or other
international accreditation scheme before use, and subsequently re-calibrated
at 3 monthly intervals throughout all stages of the leachate quality monitoring
programme. Details
of the equipment used are provided
in Table 2.21.
Table 2.21 Leachate Levels and Effluent
Quality Monitoring Details
|
Location
|
Frequency
|
Parameter
|
Monitoring Dates
|
Equipment
|
|
Leachate
levels above the basal liner
|
Continuous
|
Leachate
Levels
|
21 - 30
November 2021,
1 – 31 December
2021
|
Pairs of
pressure transducers
|
|
Effluent
discharged from LTP
|
Daily for
the first 3 months upon full operation of the LTP at wet season (Apr to Sep)
and dry season (Oct to Mar), respectively and reduce to monthly thereafter
subject to the monitoring results of the first 3 months for each season and
agreement with the EIAO Authority, IEC and IC. (a)
|
On-site
Measurements:
·
Volume
·
pH
·
Temperature
Laboratory
analysis:
·
Suspended
Solids
·
COD
·
BOD5
·
TOC
·
Ammoniacal–nitrogen
·
Nitrate-nitrogen
·
Nitrite–nitrogen
·
Total
Nitrogen
·
Sulphate
·
Phosphate
·
Oil
& Grease
·
Alkalinity
·
Chloride
·
Calcium
·
Potassium
·
Magnesium
·
Iron
·
Zinc
·
Copper
·
Chromium
·
Nickel
·
Cadmium
·
Boron
|
21 - 30
November 2021,
1 – 31
December 2021
|
Lutron WA-2017SD (S/N: T.016811)
|
|
|
|
|
|
Note:
(a)
Reduction
of monitoring frequency will be subject to the monitoring results to
demonstrate environmentally acceptable performance.
|
Monitoring Schedule for the Reporting
Month
The
schedule for leachate monitoring during the reporting period is provided in Annex
C.
Results and Observations
The
leachate levels and effluent quality monitoring results are summarised in Table
2.22 and Table 2.23, respectively. The detailed monitoring results
are provided in Annex F3 and Annex F4, respectively.
Table 2.22 Summary of Leachate Levels in
the Reporting Period
|
Month
|
Monitoring Location
|
Average Leachate Head
Levels (cm) (Range in Bracket)
|
Limit Level (cm)
|
|
|
Pump Station No. 1X
(Cell 1X)
|
|
November 2021
|
Meter No. X-1
|
61 (44 – 79)
|
> 178
|
|
Meter No. X-2
|
81 (64 – 99)
|
|
Average
|
71 (54 – 89)
|
|
December 2021
|
Meter No. X-1
|
65 (44 – 111)
|
|
Meter No. X-2
|
78 (10 – 111)
|
|
Average
|
71 (48 – 101)
|
|
|
Pump Station No. 2X
(Cell 2X)
|
|
December 2021
|
Meter No. X-1
|
81 (70 – 88)
|
> 180
|
|
Meter No. X-2
|
82 (73 – 88)
|
|
|
Average
|
81 (72 – 87)
|
|
|
|
Pump Station No. 3X
(Cell 3X)
|
|
December 2021
|
Meter No. X-1
|
89 (79 – 99)
|
> 175
|
|
Meter No. X-2
|
89 (79 – 99)
|
|
|
Average
|
89 (79 – 89)
|
|
Table 2.23 Summary of Effluent Quality
Monitoring Results in the Reporting Period
|
Month
|
Parameters
|
Average Monitoring
Results (Range in Bracket)
|
Limit Level
|
|
|
Effluent Discharged
from LTP
|
|
November 2021
|
Temperature
|
25.0°C (18.6°C
- 28.9°C)
|
> 43 °C
|
|
|
pH Value
|
8.4 (8.3 – 8.5)
|
6 – 10
|
|
|
Volume
Discharged
|
981m³ (301m³ - 1,462m³)
|
>1,500 m³
|
|
|
Suspended
Solids (SS)
|
27.0mg/L
(20.4mg/L - 35.2mg/L)
|
> 800 mg/L
|
|
|
Ammoniacal-nitrogen
|
0.40mg/L
(0.28mg/L – 0.84mg/L)
|
> 100 mg/L
|
|
|
Nitrite-nitrogen
|
0.20mg/L
(0.04mg/L – 0.63mg/L)
|
> 100 mg/L
|
|
|
Phosphate
|
9.7mg/L
(9.2mg/L – 10.3mg/L)
|
> 25 mg/L
|
|
|
Sulphate
|
64mg/L (58mg/L
– 70mg/L)
|
> 900 mg/L
|
|
|
Nitrate-nitrogen
|
60.8mg/L
(46.4mg/L – 69.6mg/L)
|
> 100 mg/L
|
|
|
BOD
|
10mg/L (6mg/L –
14mg/L)
|
> 800 mg/L
|
|
|
COD
|
1,018mg/L
(888mg/L – 1,620mg/L)
|
> 2,000 mg/L
|
|
|
Oil &
Grease
|
<5mg/L
(<5mg/L – <5mg/L)
|
> 20 mg/L
|
|
|
Boron
|
5,246µg/L
(4,900µg/L – 5,500µg/L)
|
> 7,000 µg/L
|
|
|
Iron
|
1.40mg/L
(1.28mg/L – 1.56mg/L)
|
> 7.5 mg/L
|
|
|
Cadmium
|
<1.0µg/L
(<1.0µg/L – <1.0µg/L)
|
> 1 µg/L
|
|
|
Chromium
|
126µg/L
(120µg/L – 134µg/L)
|
> 400 µg/L
|
|
|
Copper
|
11µg/L (11µg/L
– 11µg/L)
|
> 1,000 µg/L
|
|
|
Nickel
|
114µg/L (110µg/L
– 117µg/L)
|
> 800 µg/L
|
|
|
Zinc
|
65µg/L (60µg/L
– 70µg/L)
|
> 800 µg/L
|
|
December 2021
|
Temperature
|
25.7°C (20.0°C
– 30.6°C)
|
> 43 °C
|
|
|
pH Value
|
8.4 (8.3 – 8.5)
|
6 – 10
|
|
|
Volume
Discharged
|
1,025m³ (473m³ - 1,435m³)
|
>1,500 m³
|
|
|
Suspended
Solids (SS)
|
20.0mg/L (10.1mg/L
- 33.8mg/L)
|
> 800 mg/L
|
|
|
Ammoniacal-nitrogen
|
0.34mg/L
(0.15mg/L – 0.75mg/L)
|
> 100 mg/L
|
|
|
Nitrite-nitrogen
|
0.24mg/L
(0.14mg/L – 0.70mg/L)
|
> 100 mg/L
|
|
|
Phosphate
|
10.0mg/L
(7.7mg/L – 11.5mg/L)
|
> 25 mg/L
|
|
|
Sulphate
|
68mg/L (57mg/L
– 92mg/L)
|
> 900 mg/L
|
|
|
Nitrate-nitrogen
|
62.0mg/L
(42.4mg/L – 80.3mg/L)
|
> 100 mg/L
|
|
|
BOD
|
10mg/L (6mg/L –
24mg/L)
|
> 800 mg/L
|
|
|
COD
|
987mg/L
(785mg/L – 1,430mg/L)
|
> 2,000 mg/L
|
|
|
Oil &
Grease
|
<5mg/L
(<5mg/L – <5mg/L)
|
> 20 mg/L
|
|
|
Boron
|
5,143µg/L
(4,530µg/L – 6,050µg/L)
|
> 7,000 µg/L
|
|
|
Iron
|
1.44mg/L
(1.21mg/L – 1.74mg/L)
|
> 7.5 mg/L
|
|
|
Cadmium
|
<1.0µg/L
(<1.0µg/L – <1.0µg/L)
|
> 1 µg/L
|
|
|
Chromium
|
129µg/L
(112µg/L – 146µg/L)
|
> 400 µg/L
|
|
|
Copper
|
43µg/L (24µg/L
– 61µg/L)
|
> 1,000 µg/L
|
|
|
Nickel
|
114µg/L (98µg/L
– 124µg/L)
|
> 800 µg/L
|
|
|
Zinc
|
57µg/L (40µg/L
– 100µg/L)
|
> 800 µg/L
|
All
the leachate levels and
effluent quality monitoring results were below the Limit Levels in the
reporting period. No action is thus required to be undertaken in accordance
with the Event and Action Plan presented in Annex F2.
2.3.3
Groundwater
Monitoring
Monitoring Requirements and Equipment
According
to the updated EM&A Manual of the Project with incorporation of the proposed
updates under the Amendment Summary approved by EPD on 15 June 2020, groundwater monitoring was carried out
at 14 perimeter groundwater monitoring wells (including 5 up-gradient wells and
9 down-gradient wells) (i.e. MWX-1 to MWX-14) to monitor the groundwater
quality and level of the perimeter groundwater monitoring wells at monthly
interval.
The
Limit Levels for groundwater quality is provided in Table 2.24 below.
Table 2.24 Limit Levels for Groundwater
Quality
|
Location
|
Limit Levels
|
|
Ammoniacal-nitrogen (mg L-1)
|
COD (mg L-1)
|
|
MWX-1
|
5.00
|
30
|
|
MWX-2
|
5.00
|
30
|
|
MWX-3
|
5.00
|
30
|
|
MWX-4
|
7.63
|
36
|
|
MWX-5
|
5.00
|
30
|
|
MWX-6
|
5.00
|
46
|
|
MWX-7
|
6.55
|
36
|
|
MWX-8
|
15.85
|
50
|
|
MWX-9
|
7.30
|
71
|
|
MWX-10
|
5.00
|
30
|
|
MWX-11
|
5.00
|
30
|
|
MWX-12
|
5.00
|
30
|
|
MWX-13
|
5.00
|
30
|
|
MWX-14
|
5.00
|
30
|
A
bladder pump with Teflon sampling tube and adjustable discharge rates was used
for purging and taking of groundwater sample from the monitoring wells.
Filtered groundwater samples was collected by connecting a disposable in-line
filter system to the tubing of the sampling pump, prior to storage and analysis
by ALS Technichem (HK) Pty Ltd. (HOKLAS Registration No. 066).
A
portable dip meter with 5mm accuracy was used for measurement of groundwater
level at each well. The dip meter have an audio indicator of the water level
and was checked before use.
The
measurements of pH and electrical conductivity (EC) were undertaken in situ.
In situ monitoring instruments in compliance with the specifications
listed under Section 4.3.2 of the updated EM&A Manual were used to
undertake the groundwater quality monitoring for the Project.
Details of the equipment used and the monitoring locations
are summarised in Table 2.25 and illustrated in Figure
2.1,
respectively.
Table 2.25 Groundwater Monitoring Details
|
Monitoring Location
|
Frequency
|
Parameter
|
Monitoring Dates
|
Equipment
|
|
All groundwater monitoring wells
(MWX-1 to MWX-14)
|
Monthly
|
· Water level
· pH
· EC
· COD
· BOD5
· TOC
· Ammoniacal–nitrogen
· Nitrate-nitrogen
· Nitrite–nitrogen
· TKN
· TN
· Sulphate
· Sulphide
· Carbonate
· Bicarbonate
· Phosphate
|
· Chloride
· Sodium
· Potassium
· Calcium
· Magnesium
· Nickel
· Manganese
· Chromium
· Cadmium
· Copper
· Lead
· Iron
· Zinc
· Mercury
· Boron
|
7-8 Dec 2021
|
YSI Professional DSS (S/N: 17B102764)
|
|
|
|
|
|
|
Monitoring Schedule for the Reporting
Month
The
schedule for groundwater quality monitoring during the reporting period is
provided in Annex C.
Results and Observations
The
groundwater quality monitoring results and detailed monitoring results are
summarised in Table 2.26 and provided in Annex
F5, respectively.
Table 2.26 Summary of Groundwater
Monitoring Results in the Reporting Period
|
Location
|
Ammoniacal-nitrogen (mg L-1)
|
COD (mg L-1)
|
|
Monitoring Results
|
Limit Levels
|
Monitoring Results
|
Limit Levels
|
|
MWX-1
|
0.29
|
5.00
|
11
|
30
|
|
MWX-2
|
0.02
|
5.00
|
3
|
30
|
|
MWX-3
|
1.33
|
5.00
|
19
|
30
|
|
MWX-4
|
6.79
|
7.63
|
36
|
36
|
|
MWX-5
|
1.95
|
5.00
|
28
|
30
|
|
MWX-6
|
3.52
|
5.00
|
56
|
46
|
|
MWX-7
|
5.42
|
6.55
|
23
|
36
|
|
MWX-8
|
12.50
|
15.85
|
44
|
50
|
|
MWX-9
|
5.34
|
7.30
|
20
|
71
|
|
MWX-10
|
0.03
|
5.00
|
6
|
30
|
|
MWX-11
|
0.02
|
5.00
|
4
|
30
|
|
MWX-12
|
<0.01
|
5.00
|
<2
|
30
|
|
MWX-13
|
0.04
|
5.00
|
<2
|
30
|
|
MWX-14
|
<0.01
|
5.00
|
<2
|
30
|
Limit
Levels exceedance was recorded for groundwater monitoring in the reporting
period and actions in accordance with the Event and Action Plan presented in Annex
F2 were
undertaken. Investigation of the Limit Levels exceedance was conducted and the
investigation report is presented in Annex F6.
Based on the investigation conducted for the monitoring
event with potential Limit Levels exceedance with the Contractor and the IEC,
the groundwater quality (COD)
exceedance at MWX-6 on 8 December 2021 was considered non
Project-related. The Contractor was reminded to implement all
relevant mitigation measures for the construction and operation works and
maintain good site practice. The ET will keep track on the monitoring data and
ensure Contractor’s compliance of the environmental requirements.
2.4
Landfill Gas Monitoring
2.4.1
Monitoring
Requirements
According to the updated EM&A Manual of the
Project, landfill gas monitoring was carried out at the perimeter of the waste boundary
(monitoring wells), area between the SENTX Site boundary and the waste boundary
(surface emission), occupied on-site building, service voids, utilities pit and
manholes in the vicinity of the SENTX (build-up of landfill gas) during the
operation/restoration phase.
The Limit Levels for landfill gas monitoring is
provided in Table 2.27 below.
Table 2.27 Limit Levels
for Landfill Gas Constituents
|
Parameters
|
Monitoring Location
|
Limit Level (% (v/v))
|
|
Perimeter Landfill Gas
Monitoring Wells (a)
|
|
|
Methane & Carbon
Dioxide
|
|
Methane
|
Carbon Dioxide
|
|
|
LFG1
|
1.0
|
2.2
|
|
|
LFG2
|
1.0
|
4.2
|
|
|
LFG3
|
1.0
|
6.3
|
|
|
LFG4
|
1.0
|
7.0
|
|
|
LFG5
|
1.0
|
3.4
|
|
|
LFG6
|
1.0
|
9.1
|
|
|
LFG7
|
1.0
|
1.5
|
|
|
LFG8
|
1.0
|
1.7
|
|
|
LFG9
|
2.5
|
1.7
|
|
|
LFG10
|
1.0
|
1.6
|
|
|
LFG11
|
3.0
|
2.0
|
|
|
LFG12
|
13.2
|
1.5
|
|
|
LFG13
|
22.5
|
2.7
|
|
|
LFG14
|
1.0
|
1.6
|
|
|
LFG15
|
18.2
|
2.0
|
|
|
LFG16
|
1.0
|
1.7
|
|
|
LFG17
|
10.5
|
2.1
|
|
|
LFG18
|
2.3
|
1.9
|
|
|
LFG19
|
6.3
|
3.1
|
|
|
LFG20
|
1.0
|
4.2
|
|
|
LFG21
|
1.0
|
4.3
|
|
|
LFG22
|
1.0
|
3.9
|
|
|
LFG23
|
1.0
|
10.3
|
|
|
LFG24
|
1.0
|
4.0
|
|
|
GP1
|
1.0
|
8.5
|
|
|
GP2 (shallow)
|
1.0
|
11.4
|
|
|
GP2 (deep)
|
1.0
|
10.4
|
|
|
GP3 (shallow)
|
1.0
|
3.9
|
|
|
GP3 (deep)
|
1.0
|
1.9
|
|
|
GP4 (shallow)
|
1.0
|
2.3
|
|
|
GP4 (deep)
|
1.0
|
5.6
|
|
|
GP5 (shallow)
|
1.0
|
9.5
|
|
|
GP5 (deep)
|
1.0
|
7.5
|
|
|
GP6
|
1.0
|
7.8
|
|
|
GP7
|
1.0
|
4.5
|
|
|
GP12
|
1.0
|
2.3
|
|
|
GP15
|
1.0
|
2.2
|
|
|
P7
|
1.0
|
2.5
|
|
|
P8
|
1.0
|
1.7
|
|
|
P9
|
1.0
|
2.7
|
|
Service
Voids, Utilities Pits and Manholes
|
|
Methane
(or flammable gas)
|
Service
voids, utilities pits and manholes
|
1% by volume
|
|
Permanent Gas Monitoring
System
|
|
Methane
(or flammable gas)
|
Permanent
Gas Monitoring System
|
1% by volume (20% LEL)
|
|
Notes:
(a) Provisional
Limit Levels established based on the pre-operation phase baseline and
additional landfill gas monitoring results in the Pre-operation Baseline
Monitoring Report.
|
Gas analysers in compliance with the specifications listed
under Section 5.4.1 of the updated EM&A Manual were used to monitor the gas
parameters at the landfill gas monitoring wells, service voids, utilities pits
and manholes. The gas analyser was calibrated by a laboratory accredited under
HOKLAS at yearly intervals and checked before use to ensure the validity and
accuracy of the results. A
portable dip meter was used to monitor the water level in the monitoring wells.
Permanent gas monitoring systems with pre-set alarm levels for methane at
20% lower explosive limit (LEL, equivalent to 1% methane gas (v/v)) were installed and operated
in all occupied on-site buildings at SENTX. A central control panel is equipped to
alert site personnel when the gas concentration at any detector reaches the
alarm level.
The
equipment used in the landfill gas monitoring programme is summarised in Table
2.28. The landfill gas monitoring locations for perimeter landfill gas
monitoring wells and
service voids, utilities and manholes along the Site boundary and within the
SENTX site are illustrated
in Figure 2.3 and Annex G1, respectively.
Table 2.28 Landfill Gas Monitoring Details
|
Monitoring Location
|
Frequency
|
Parameter
|
Monitoring Dates
|
Equipment
|
|
Perimeter landfill gas
monitoring wells (LFG1 to LFG24, P7 to P9, GP1 to GP7, GP12 and GP15)
|
Monthly
|
Ÿ Methane
Ÿ Carbon dioxide
Ÿ Oxygen
Ÿ Atmospheric pressure
|
14 Dec 2021
|
GA5000 (S/N: G507306)
|
|
Service voids, utilities
and manholes along the Site boundary and within the SENTX Site (UU1 to UU28)
|
Monthly
|
Ÿ Methane
Ÿ Carbon dioxide
Ÿ Oxygen
|
16 Dec 2021
|
GA5000 (S/N: G507306)
|
|
Permanent gas monitoring
system in all occupied on-site buildings
|
Continuous
|
Ÿ Methane (or flammable gas) by
permanent gas monitoring system
|
1 – 31 Dec 2021
|
Permanent gas monitoring
system
|
Monitoring Schedule for the Reporting
Month
The
schedule for dust monitoring during the reporting period is provided in Annex
C.
Results and Observations
The
landfill gas monitoring results are summarised and provided in Tables 2.29 -
2.30 and Annex G2, respectively.
Table 2.29 Summary of Landfill Gas
Monitoring Results at Perimeter LFG Monitoring Wells in the Reporting Period
|
Location
|
Methane (% (v/v))
|
Carbon Dioxide (% (v/v))
|
|
Monitoring Results
|
Limit Levels (a)
|
Monitoring Results
|
Limit Levels (a)
|
|
LFG1
|
0.0
|
1.0
|
0.1
|
2.2
|
|
LFG2
|
0.0
|
1.0
|
0.1
|
4.2
|
|
LFG3
|
0.0
|
1.0
|
0.9
|
6.3
|
|
LFG4
|
0.0
|
1.0
|
0.0
|
7.0
|
|
LFG5
|
0.0
|
1.0
|
0.2
|
3.4
|
|
LFG6
|
0.0
|
1.0
|
0.1
|
9.1
|
|
LFG7
|
0.0
|
1.0
|
0.0
|
1.5
|
|
LFG8
|
0.0
|
1.0
|
0.0
|
1.7
|
|
LFG9
|
0.0
|
2.5
|
0.1
|
1.7
|
|
LFG10
|
0.0
|
1.0
|
0.0
|
1.6
|
|
LFG11
|
0.0
|
3.0
|
0.1
|
2.0
|
|
LFG12
|
0.0
|
13.2
|
0.0
|
1.5
|
|
LFG13
|
19.6
|
22.5
|
0.0
|
2.7
|
|
LFG14
|
0.0
|
1.0
|
0.0
|
1.6
|
|
LFG15
|
1.8
|
18.2
|
0.4
|
2.0
|
|
LFG16
|
0.0
|
1.0
|
0.1
|
1.7
|
|
LFG17
|
0.0
|
10.5
|
0.2
|
2.1
|
|
LFG18
|
0.0
|
2.3
|
0.1
|
1.9
|
|
LFG19
|
0.0
|
6.3
|
0.1
|
3.1
|
|
LFG20
|
0.0
|
1.0
|
1.1
|
4.2
|
|
LFG21
|
0.0
|
1.0
|
2.0
|
4.3
|
|
LFG22
|
0.0
|
1.0
|
1.0
|
3.9
|
|
LFG23
|
0.0
|
1.0
|
2.1
|
10.3
|
|
LFG24
|
0.0
|
1.0
|
0.9
|
4.0
|
|
GP1
|
0.2
|
1.0
|
5.2
|
8.5
|
|
GP2 (shallow)
|
0.5
|
1.0
|
0.3
|
11.4
|
|
GP2 (deep)
|
0.2
|
1.0
|
0.1
|
10.4
|
|
GP3 (shallow)
|
0.3
|
1.0
|
2.5
|
3.9
|
|
GP3 (deep)
|
0.1
|
1.0
|
0.2
|
1.9
|
|
GP4 (shallow)
|
0.6
|
1.0
|
0.7
|
2.3
|
|
GP4 (deep)
|
0.7
|
1.0
|
1.7
|
5.6
|
|
GP5 (shallow)
|
0.1
|
1.0
|
5.4
|
9.5
|
|
GP5 (deep)
|
0.1
|
1.0
|
0.3
|
7.5
|
|
GP6
|
0.0
|
1.0
|
5.6
|
7.8
|
|
GP7
|
0.0
|
1.0
|
0.1
|
4.5
|
|
GP12
|
0.0
|
1.0
|
0.0
|
2.3
|
|
GP15
|
0.0
|
1.0
|
0.0
|
2.2
|
|
P7
|
0.0
|
1.0
|
0.0
|
2.5
|
|
P8
|
0.0
|
1.0
|
0.0
|
1.7
|
|
P9
|
0.0
|
1.0
|
0.0
|
2.7
|
|
Notes:
(a) Provisional
Limit Levels established based on the pre-operation phase baseline and
additional landfill gas monitoring results in the Pre-operation Baseline
Monitoring Report.
|
Table 2.30 Summary of Landfill Gas
Monitoring Results at Service Voids, Utilities Pits and Manholes in the
Reporting Period
|
Location
|
Methane (% (v/v))
|
|
Monitoring Results
|
Limit Levels
|
|
UU01
|
0.1
|
1.0
|
|
UU02
|
0.0
|
1.0
|
|
UU03
|
0.0
|
1.0
|
|
UU04
|
0.1
|
1.0
|
|
UU05
|
0.0
|
1.0
|
|
UU06
|
0.0
|
1.0
|
|
UU07
|
0.1
|
1.0
|
|
UU08
|
0.0
|
1.0
|
|
UU09
|
0.2
|
1.0
|
|
UU10
|
0.1
|
1.0
|
|
UU11
|
Inaccessible due to on-going
construction work
|
1.0
|
|
UU12
|
Inaccessible due to on-going
construction work
|
1.0
|
|
UU13
|
Inaccessible due to on-going
construction work
|
1.0
|
|
UU14
|
Inaccessible due to on-going
construction work
|
1.0
|
|
UU15
|
0.1
|
1.0
|
|
UU16
|
0.1
|
1.0
|
|
UU17
|
0.3
|
1.0
|
|
UU18
|
0.1
|
1.0
|
|
UU19
|
0.0
|
1.0
|
|
UU20
|
0.1
|
1.0
|
|
UU21
|
0.0
|
1.0
|
|
UU22
|
0.0
|
1.0
|
|
UU23
|
0.0
|
1.0
|
|
UU24
|
0.0
|
1.0
|
|
UU25
|
0.0
|
1.0
|
|
UU26
|
0.0
|
1.0
|
|
UU27
|
0.0
|
1.0
|
|
UU28
|
0.0
|
1.0
|
The alarm of the permanent gas monitoring systems with pre-set levels for methane at 20% lower
explosive limit (LEL, equivalent to 1% methane gas (v/v)) was not triggered at all
occupied on-site buildings at SENTX in November and December 2021.
All
the landfill gas monitoring
results were below the Limit Levels in the reporting period. No action is thus
required to be undertaken in accordance with the Event and Action Plan
presented in Annex G3.
2.5
Landscape and Visual Monitoring
2.5.1
Monitoring
Requirements
According to the updated EM&A Manual of the Project, the monthly
landscape and visual audit
was conducted on 26 October, 19 November and 22 December 2021 to monitor the implementation of the
landscape and visual mitigation measures during construction and operation/
restoration phase.
All
relevant environmental mitigation measures listed in the approved EIA Report
and the updated EM&A Manual and their implementation status are summarised
in Annex B.
2.5.2
Results and
Observations
The
Contractor has implemented environmental mitigation measures as stated in the
approved EIA Report and the EM&A Manual.
Regarding
the landscape and visual audit, the Contractor was reminded to maintain the
advance screen planting works as soon as possible to ensure effective screening
of views of project works from the High Junk Peak Trail. The Contractor has considered
the mitigation measures during the design phase, including the preparation of
the Construction Drawings and Detailed Landscape Design Drawings.
Site inspections were carried out on a weekly basis with
the Contractor, IEC and ER to monitor the implementation of proper
environmental pollution control and mitigation measures for air quality, noise, surface water
quality and waste management under
the Project. In the reporting period, 13 site inspections were carried out on 7,
15, 21 and 28 October, 4, 11, 17 and 26 November and 2, 9, 16, 23 and 30
December 2021.
Key observations during the
site inspections are summarized in Table 2.31.
Table 2.31 Key Observations Identified
during the Site Inspections in this Reporting Period
|
Inspection Date
|
Environmental Observations and Recommendations
|
|
7 October 2021
|
·
The
Contractor shall enhance watering around the site, especially at Cell4X and
near existing LFG plant.
·
The
Contractor shall provide drip trays for the chemical stored near existing LFG
plant and new container area.
·
The
Contractor shall remove the stagnant water accumulated near site entrance and
spray larvicides for mosquito control, if necessary.
·
The
Contractor shall maintain the wheel washing facilities at the site exit to
ensure it is functioning properly at all times.
·
The
Contractor shall remove the general refuse accumulated near new container
area and at the temporary drains and dispose of the waste regularly.
|
|
15 October 2021
|
·
The
Contractor shall ensure that the Wetseps are functioning properly at all
times and all surface water discharged at DP4T and DP6 is treated before
discharge.
·
The
Contractor shall clean up the oil spillage near DP6 and handle the clean-up
materials as chemical waste.
·
The
Contractor shall provide drip trays for the chemicals stored near MSE wall,
new container area and X9B.
·
The
Contractor shall remove the stagnant water accumulated at the drip tray near
new container area and treat the clean-up materials as chemical waste.
|
|
21 October 2021
|
·
The
Contractor shall fix the oil interceptor at DP4T Wetsep outlet to ensure that
all surface water is treated by the oil interceptor before discharge.
·
The
Contractor shall display NRMM labels on the generator near site entrance and
excavator near sump house 3.
·
The
Contractor shall remove the deposited silt and grit accumulated at DP6
regularly to ensure it is functioning properly at all times.
·
The Contractor
shall provide drip trays for the chemicals stored at new container area and
remove the stagnant water accumulated in the drip trays near Cell4X and site
entrance and treat the clean-up materials as chemical waste.
·
The
Contractor shall dispose of the emptied chemical container in the refuse skip
near DP4T as chemical waste in the chemical waste cabinet.
·
The
Contractor shall remove the general refuse accumulated near site entrance and
new container area and dispose of the waste regularly to minimise odour and
pest issues.
|
|
28 October 2021
|
·
The
Contractor shall fix the oil interceptor at DP4T Wetsep outlet to ensure that
all surface water is treated by the oil interceptor before discharge.
·
The
Contractor shall clean up the oil spillage near site entrance and existing
LFG plant and handle the clean-up materials as chemical waste.
·
The
Contractor shall provide proper drip trays for the chemicals stored at new
container area and LTP and the generator near EPD building. The Contractor
shall also remove the stagnant water accumulated in the drip trays near sump
house 2 and EPD building and treat the clean-up materials as chemical waste.
·
The
Contractor shall maintain the signage of the chemical waste cabinet at new
container area in accordance with the COP.
·
The
Contractor shall remove the general refuse accumulated around the site,
especially near DP4T Wetsep, guardhouse and EPD building and dispose of the
waste regularly to minimise odour and pest issues.
|
|
4 November 2021
|
·
The
Contractor shall replace the faded NRMM label displayed on the cherry picker
near future weighbridge.
·
The
Contractor shall maintain site drainage and remove the stagnant water and
algae accumulated at the temporary drain at new container area and spray
larvicides for mosquito control, if necessary.
·
The
Contractor shall clean up the oil spillage at Southern perimeter bund and
near EPD building and handle the clean-up materials as chemical waste.
·
The
Contractor shall remove the concrete residue at the concrete truck washing
area to ensure that all wash-water is properly contained.
·
The
Contractor shall maintain the signage of the chemical waste cabinet at new
container area in accordance with the COP.
·
The
Contractor shall dispose of the emptied chemical containers near EPD building
as chemical waste.
·
The
Contractor shall remove the general refuse accumulated at new container area
and dispose of the waste regularly to minimise odour and pest issues.
|
|
11 November 2021
|
·
The
Contractor shall spray water on the surface continuously during rock breaking
operation at the buttress wall to minimise dust impact.
·
The
Contractor shall cover the cement stored at new container area to minimise
dust impact.
·
The
Contractor shall clean up the oil spillage at the breaker near future
guardhouse and at the EVA and handle the clean-up materials as chemical
waste.
·
The
Contractor shall provide drip trays for the chemicals stored near buttress
wall.
·
The
Contractor shall maintain the signage of the chemical waste cabinet at new
container area in accordance with the COP.
|
|
17 November 2021
|
·
The
Contractor shall clean up the oil spillage at the breaker near town gas plant
and handle the clean-up materials as chemical waste.
·
The
Contractor shall remove the stagnant water accumulated at the drip tray near
DP6 and treat the clean-up material as chemical waste.
·
The
Contractor shall remove the general refuse accumulated near DP4T, main haul
road, weighbridge, town gas plant, drainage channel near maintenance building
and DP6.
|
|
26 November 2021
|
·
The
Contractor shall clean up the oil/ chemical spillage at the generator near
DP6 and handle the clean-up materials as chemical waste.
·
The
Contractor shall provide drip trays for the chemicals stored near guardhouse
and sediment trap.
·
The
Contractor shall dispose of the waste accumulated at the refuse skips near
DP4T and DP6 regularly to minimise odour and pest issues.
|
|
2 December 2021
|
·
The
Contractor shall clean up the oil spillage at sediment trap and handle the
clean-up materials as chemical waste.
·
The
Contractor shall trim the climbing plants around the transplanted trees near
DP6 regularly.
|
|
9 December 2021
|
·
The
Contractor shall provide drip trays for the chemicals stored near EPD
building, diesel fuel tank and at Cell 1X slope.
·
The
Contractor shall provide drip trays for the chemicals stored near EPD
building, diesel fuel tank and at Cell 1X slope.
|
|
16 December 2021
|
·
The
Contractor shall replace the faded NRMM labels displayed on the excavators
near Cell 4X and EPD building.
·
The
Contractor shall remove the general refuse accumulated near town gas plant
and at the sediment trap and dispose of the waste regularly.
|
|
23 December 2021
|
·
The
Contractor shall replace the faded NRMM label displayed on the excavator near
Cell 4X.
·
The
Contractor shall remove the general refuse accumulated near water services
house and dispose of the waste regularly.
·
The
Contractor shall cover/ remove the stockpile of dusty materials near EPD
building to minimise dust impact.
|
|
30 December 2021
|
·
The
Contractor shall clean up the oil spillage at the generators near GVL building
and handle the clean-up materials as chemical waste.
·
The
Contractor shall remove the general refuse accumulated in the refuse skip
near LTP regularly to minimise odour and pest issues.
·
The
Contractor shall remove the stagnant water accumulated at the channel near
sump house 3 and spray larvicides for mosquito control, if necessary.
|
The
Contractor has rectified all of the observations identified during
environmental site inspections in the reporting period. Key environmental
deficiencies identified and the corresponding rectification actions are presented
in Table 2.32.
Table 2.32 Summary of Environmental
Deficiencies Identified and Corresponding Additional Control Measures
|
Deficiencies
|
Rectifications Implemented
|
Proposed Additional Control Measures
|
|
Surface
Water
|
|
Intercepting channels & drainage
system
|
Ÿ
Reviewed
drainage plan.
|
Ÿ Provision of additional drainage
channels.
Ÿ Expedite the construction of permanent
sediment trap and discharge culverts.
|
|
DP channels (design & regular silt
removal)
|
Ÿ Carried out
regular maintenance and cleaning of channels.
Ÿ DP4 channel: Area near the channel was
paved with concrete and a bund was built.
Ÿ DP6 channel: Gravel piles on the
channel were covered with concrete which serve as blocks for running water
and to divide the channel into several sections. A pump was placed in the
water zone in the upstream section to pump water to the Wetsep for treatment
prior to the discharge to the last section before the weir plate.
Ÿ DP6: Pipes through the gravel piles
between different channel sections were covered with geotextiles to block debris and silt.
|
N.A.
|
|
Stockpiles & exposed soil
|
Ÿ
Installed silt fencing near surface water channel along DP6
channel.
|
Ÿ Improve soil covering.
Ÿ Compaction and cover for stockpiles and
soil slopes.
|
|
Wetsep (treatment capacity &
number)
|
Ÿ Reviewed Wetsep capacity.
Ÿ Chemicals dosage of the Wetsep was
increased to enhance the efficiency.
|
Ÿ
Install
additional Wetsep.
|
|
Backflow / ponding during heavy
rainfall
|
Ÿ
Raised
with EPD (LDG) and CEDD.
|
N.A.
|
The
Contractor has registered as a chemical waste producer under the Contract. Sufficient
numbers of receptacles were available for general refuse collection and
sorting.
As
informed by the Contractor, waste generated during this reporting period
include mainly inert C&D materials. Reference has been made to the waste
flow table prepared by the Contractor. The quantities of different types of
wastes and imported fill materials are summarised in Table 2.33.
Table 2.33 Quantities of Different Waste Disposed
and Imported Fill Materials
|
Month/
Year
|
Inert
C&D Materials (a) (in ‘000m3)
|
Imported
Fill
(in ‘000kg) (b)
|
Inert
Construction Waste Re-used
(in ‘000m3)
|
Non-inert
Construction Waste (c)
(in ‘000m3)
|
Recyclable
Materials (d) (in ‘000kg)
|
Chemical
Wastes
(in ‘000kg)
|
|
Rock
|
Soil
|
|
Oct
2021
|
0.710
|
0
|
1912.010
|
0
|
0.053
|
0
|
0
|
|
Nov
2021
|
3.152
|
0
|
1378.680
|
0
|
0.121
|
222.310
|
0
|
|
Dec
2021
|
0.412
|
0
|
2043.810
|
0
|
0.058
|
11.660
|
0.800
|
|
Notes:
(a)
Inert
construction wastes include hard rock and large broken concrete, and
materials disposed as public fill. Density assumption: 1.6 (kg/L) for public
fill.
(b)
Imported
fill refers to materials generated from other project for on-site reuse.
(c)
Non-inert
construction wastes include general refuse disposed at landfill. Density
assumption: 0.9 (kg/L) for general refuse.
(d)
Recyclable
materials include metals, paper, cardboard, plastics and others.
|
2.8
Implementation Status of Environmental Mitigation
Measures
A
summary of the Environmental Mitigation Implementation Schedule is presented in
Annex B. The necessary
mitigation measures were implemented properly for the Project.
The
construction and operation/ restoration phase noise and landfill gas monitoring
results complied with the Action and Limit Levels in the reporting period. One exceedance of the
Limit Level for TSP and one exceedance of the
Limit Level for landfill gas flare stack emission (CO) were recorded for air
quality impact monitoring in the reporting period. The TSP exceedance at
AM4 on 13 December 2021 was considered non Project-related upon further
investigation. The landfill gas flare stack
emission (CO) exceedance on
17 December 2021 was found to be Project-related. One exceedance of the Limit Level for
groundwater (COD) was recorded for water quality impact monitoring in the
reporting period. The
groundwater
(COD) exceedance at MWX-6
on 8 December 2021 was
considered non Project-related upon further investigation.
Cumulative
statistics on exceedances is provided in Annex H.
There
were no complaints, notification of summons or prosecution recorded in the
reporting period.
Statistics
on complaints, notifications of summons and successful prosecutions are summarised
in Annex H.
3
Conclusion and
Recommendation
This Quarterly EM&A Report presents the findings of the
EM&A activities undertaken during the period from 1 October to 31 December
2021 in accordance with the updated EM&A Manual and the requirements of the
Environmental Permit (EP-308/2008/B).
Air quality (24-hour TSP, odour, thermal oxidiser, landfill
gas flare and landfill gas generator stack emission), noise, water quality
(surface water, leachate and groundwater) and landfill gas monitoring were
carried out in the reporting period. Results for noise and landfill gas
monitoring complied with the Action and Limit Levels in the reporting period. One exceedance of the Limit
Level for TSP, one exceedance of the Limit
Level for landfill gas flare stack emission (CO) and one exceedance of the
Limit Level for groundwater (COD) were recorded in the reporting period.
Thirteen
environmental site inspections were carried out during the reporting period. Environmental
deficiencies were identified during the site inspection and the Contractor has
proposed additional control measures to rectify the deficiencies.
There
were no complaints, notification of summons or prosecution recorded in the
reporting period.
It
is noted that most environmental pollution control and mitigation measures were
properly implemented and the construction and operation activities of the
Project did not introduce any adverse impact to the sensitive receivers in the
reporting period. Yet, some environmental deficiencies were identified during
the reporting period and additional control measures have been proposed by the
Contractor to rectify the corresponding deficiencies. The monitoring programme
has been reviewed and was considered as adequate to cater for the nature of
works in progress. Change to the monitoring programme was thus not recommended
at this stage. The monitoring programme will be evaluated as appropriate in
the next reporting period. The ET will keep track on the construction works to
confirm compliance of environmental requirements and the proper implementation
of all necessary mitigation measures.